By DANIELA OLARIU

News organizations have been closing at three times the rate that new ones are being launched. Community newspapers are the most frequently closed news outlets across the country and new online media isn’t making up for the losses of more traditional news media. These are just some of the striking observations that can be made from the newly released Local News Map Data Reports.
It’s the start of a new series of reports that will be summarizing the data from the Local News Map.
“We wanted to make the data from the map more generally available on a regular basis so that’s why we decided to start producing these reports every second month,” says April Lindgren, the map’s co-creator and principal investigator for the Local News Research Project at Ryerson University’s School of Journalism.
“The idea is to create a historical record of reports that would be useful for researchers and other people trying to monitor what’s happening to local news in Canada.”
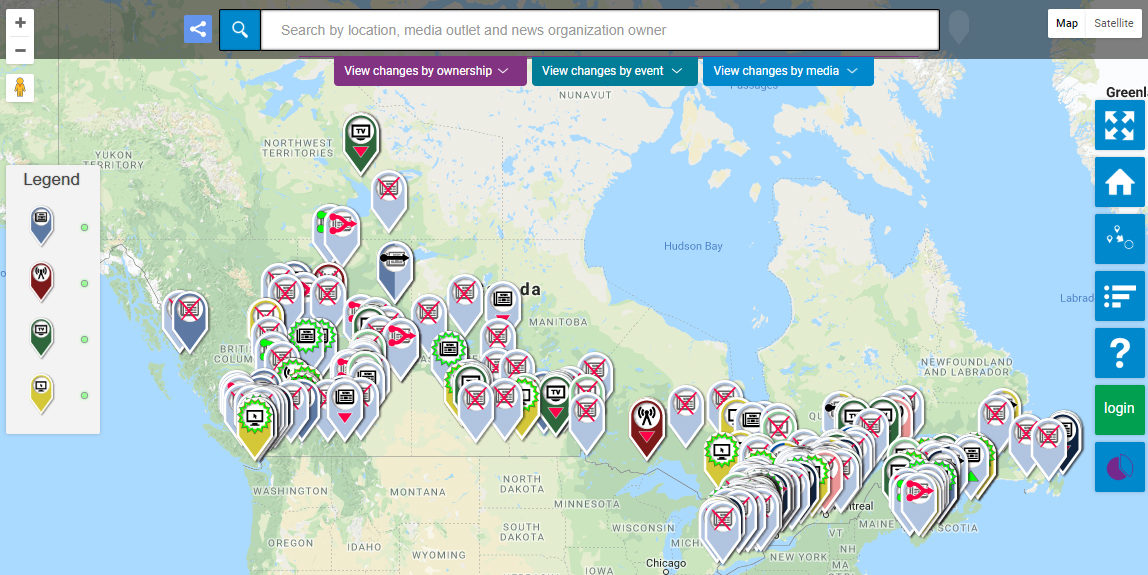
The Local News Map is a crowd-sourced tool that tracks what is happening to local newspapers, broadcast outlets and online news sites in communities across Canada. It displays data going back to 2008, which marked the beginning of a deep recession and a turning point for many previously profitable local news organizations. The map is a collaborative project undertaken by Lindgren and Associate Professor Jon Corbett, who leads the University of British Columbia’s SpICE Lab (Spatial Information for Community Mapping).
The Future of Local News website provides a more detailed overview of the map’s purpose.
The reports give people easier access to the data – in a way that’s reliable and clearly summarized. They also provide some information that the map doesn’t.
“On the map, there is no readily available data for the number of affected communities so we do a data analysis to get that in the report,” Lindgren says. “The other interesting thing is that we included the provincial breakdown for changes to local news media since 2008.”
The map is continuously monitored by Lindgren and Corbett to make sure the information is correct. To submit a marker, an online link for the information must be provided so they can verify it.
“It’s Important to remember it’s a crowdsourced resource so it’s not perfect and you will see fluctuations as we moderate the map and correct errors. At least now we have some sort of a record indicating patterns and trends and providing concrete data for local news.”


