This map tracks the impact of COVID-19 on media outlets in Canada after March 11, 2020, when the World Health Organization declared a global pandemic. For large companies, in many cases it is not clear from the information available which divisions, publications or programs have been affected so we have mapped the changes to the head office location and mapped the specific outlets where there is known impact. This means that the number of affected outlets is underrepresented on the map/in the data.
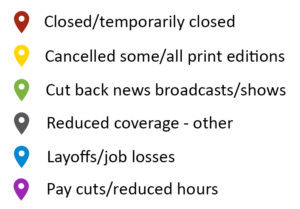
Specific markers represent daily newspapers, community newspapers (published fewer than four times per week), magazines, television and radio broadcasters and online news sites. Click the button in the top left corner to view each of these media types and add/remove layers.The icons below are used to represent the different types of media. The colour of these markers shows the type of COVID-19 impact on media outlets. Where there is more than one impact, markers display the colour representing the media impact according to this order:

![]()
To search for a specific media outlet or region, click the button in the top right corner to view a larger map.
This map is a joint initiative of the Local News Research Project at Toronto Metropolitan University, J-Source and the Canadian Association of Journalists. Funding for this project has been provided by the Rossy Foundation, the Ken and Debbie Rubin Public Interest Advocacy Fund and Toronto Metropolitan University. It will be regularly updated. The raw data can be downloaded here and a fact sheet summarizing the data can be downloaded here.
If you have additional information about how COVID-19 has affected a news organization in Canada, please contact us at info@j-source.ca or fill in details using the form COVID-19: Impacts on media in Canada.
